Vizualizing Ancient Star Catalogs
• James Hedberg
It’s often said that astronomy is the oldest science. That must mean they had some data? Right? What’s science without data. Here we look at visualizing some of the oldest data sets from astronomy.
Cladius Ptolemy - The Almagest
First up is Ptolemy’s Catalog of Stars from his book Μαθηματικὴ Σύνταξις otherwise known as The Almagest. In addition to laying out an entire cosmological system rooted in Euclidean Geometry, Ptolemy also included a catalog of 1022 ‘fixed stars’, listing their positions (ecliptic latitude and longitude) as well as a data point indicating the star’s apparent brightness (on a scale of 1-6, 1 being the brightest).
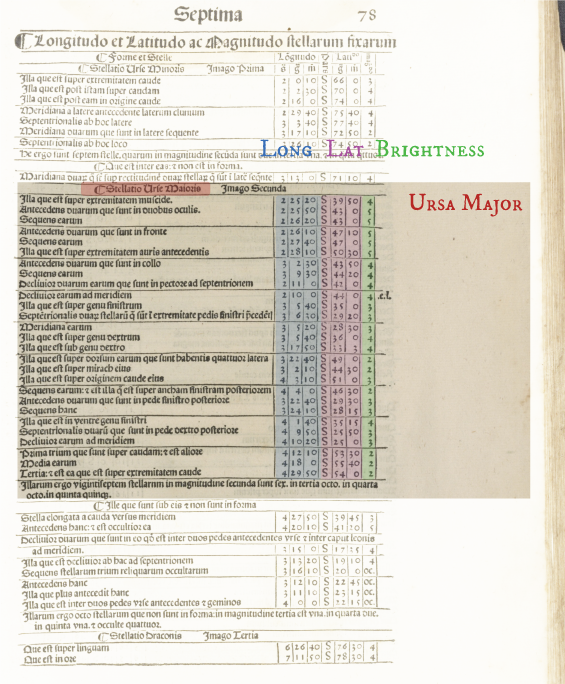
Much work has already been done analyzing these tables of star positions - our task here is not to dig too deep into the data set and its artifacts, but rather to make a compelling visualization. Several technical issues arise when trying to do so. First, we can’t just throw a 500 year old scanned image at a piece of software and have it turn it into a picture. A dedicated individual needs to type all those numbers up into a machine readable file. Of course I’d be up for it, but it’s been done before in several places. (Graßhoff, 1990; Ptolemy, G. J. Toomer 1984)
Next, we have to understand what the numbers are indicating. For Ptolemy, the most natural system of measurements involved using the degrees above and below the ecliptic plane, and the degrees east or west of the vernal equinox - the location in the sky where the ecliptic plane crosses the celestial equator. The tricky thing is that due to orbital precession, this position changes about 1 degree every 72 years. So, we need to know when Ptolemy made1 these measurements in order to convert them the modern epoch. Again, fortunately, this has been done. (Peters, 1915) While it’s still a very complicated and thorny issue, the best estimate for which equinox to use has been figured out to be 58 AD. This value gives the best overlap with the modern stars, on average.
So, now we can transform this table of data into something modern sci-viz software can work with. With a little help from astropy.coordinates, this task is a breeze. (Full script in the GitHub Repo) Here at the CCNY Planetarium, we use OpenSpace to do our simulations, which can read in a table of X,Y,Z positions for a star catalog and make nice little stars in the right place in sky, with appropriate brightness levels.
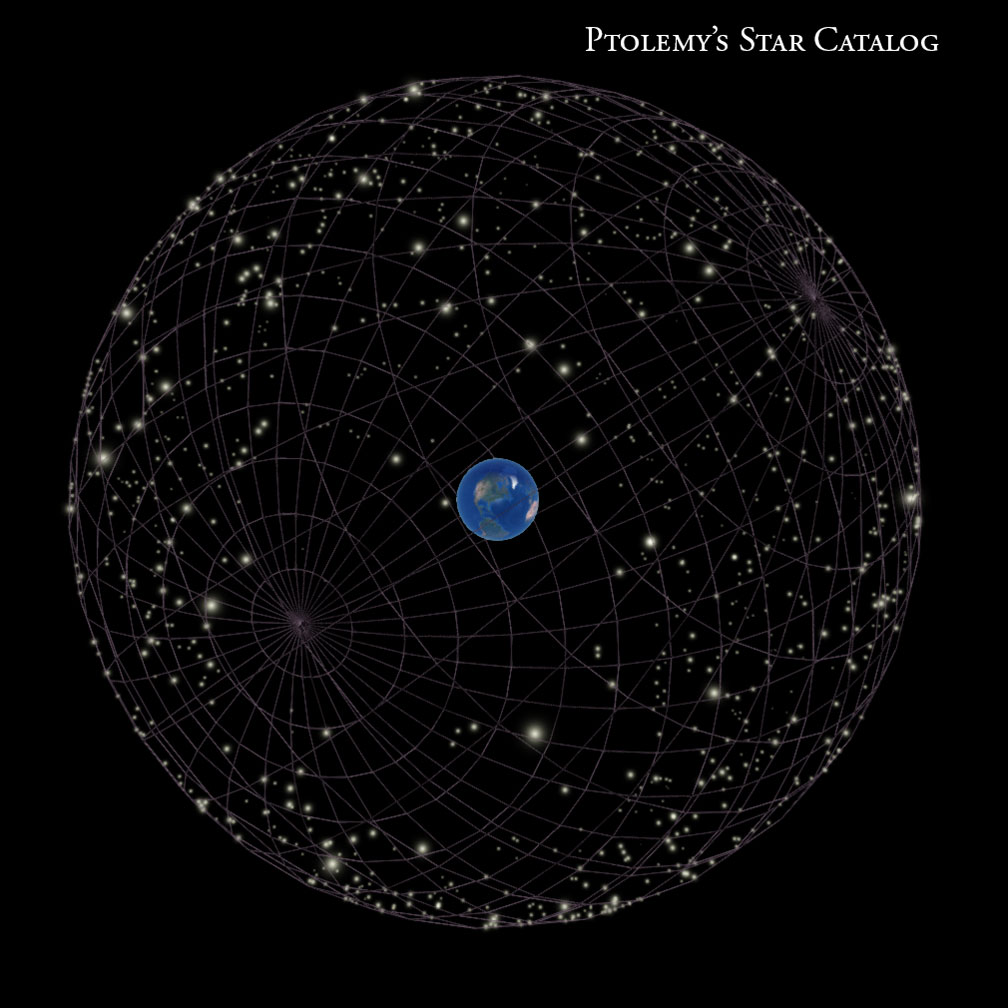
Now, several things are immediately obvious. Most notably, all the stars are the same distance away from the Earth. We now know the stars are not equidistant from the earth, but back in Ptolemy’s time, they had a different cosmological model in which all the stars where indeed the same distance from the Earth, and much too close. However, we can begin to see the beauty in the data here. Look closely just above the center of the image and you’ll see the familiar Big Dipper (or Plough) asterism, part of the constellation of Ursa Major. Stop and marvel in the fact that you’re looking at a dataset from almost 2000 years ago. Seriously. Just stop and marvel at it.
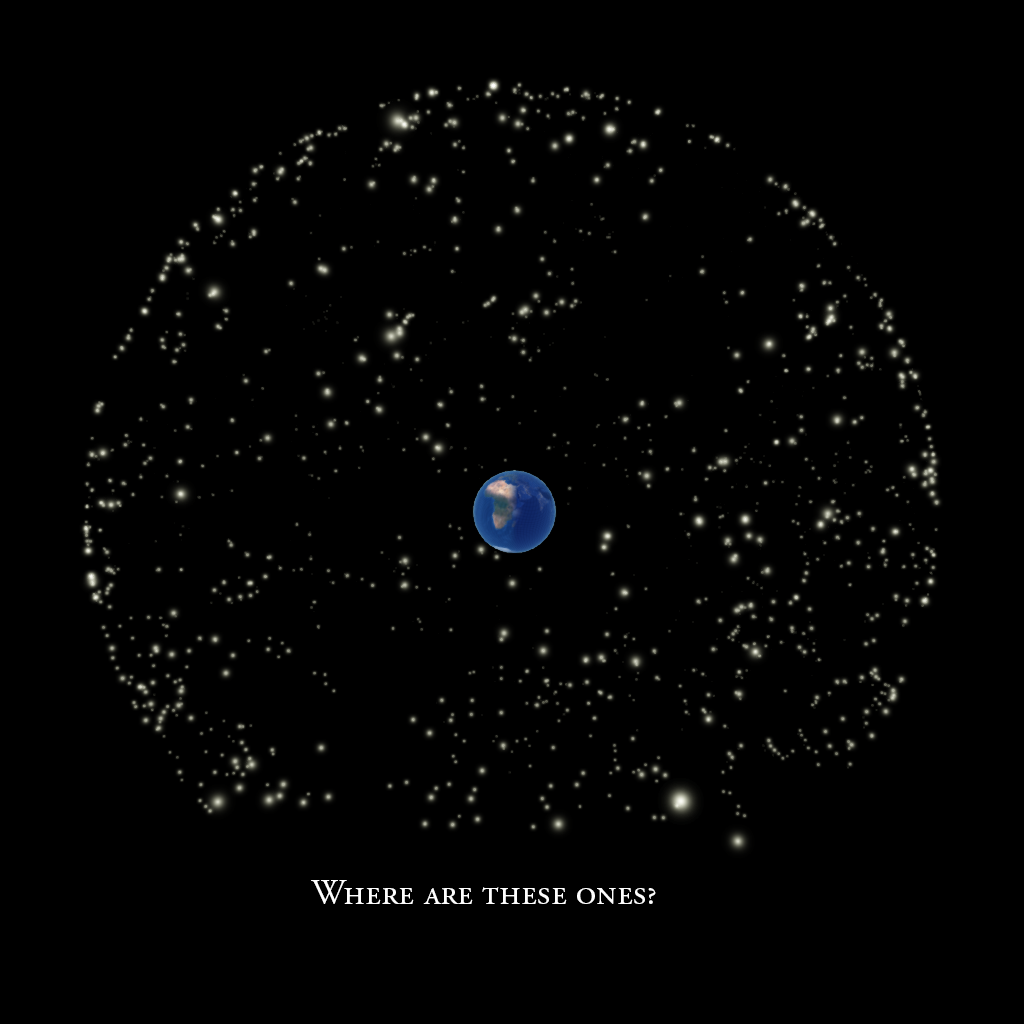
Another artifact of the data, is that there are no stars towards the bottom, surrounding the southern pole. Of course there are plenty of stars there in reality, the problem was that that region wasn’t visible from the northern hemisphere where the measurements where made. (Later, Edmond Halley would chart the southern skies and fill in the gaps by adding 341 southern stars. )
Despite its imperfections (only visible really from our modern vantage point), the importance of this ‘database’ for the development of astronomy cannot be overstated. It remains the oldest extant table of such data and was used for centuries to help understand the motions of the heaven. And then, a new astronomer came on the scene.
Tycho Brahe + Johannes Kepler - Tabulae Rudolphinae
Tycho was from Denmark, and he had a passion for all things exact. Among his numerous contributions to the development of science, and there were many, was a new catalog of stars. The technology he invented to make the observations is an entire story in itself. For our purposes, we’ll refrain from telling that story (except for mentioning he had an entire castle constructed on an island for making astronomical measurements), and stick to the task at hand.
We can find his data in accessible formats thanks to many scholars’ contributions, including none other than Johannes Kepler, who published the Tycho data sets in 1627 as part of his Rudolphine Tables, a collection of data sets for stars and planets. (F. Verbunt & R. H. van Gent, 2010)
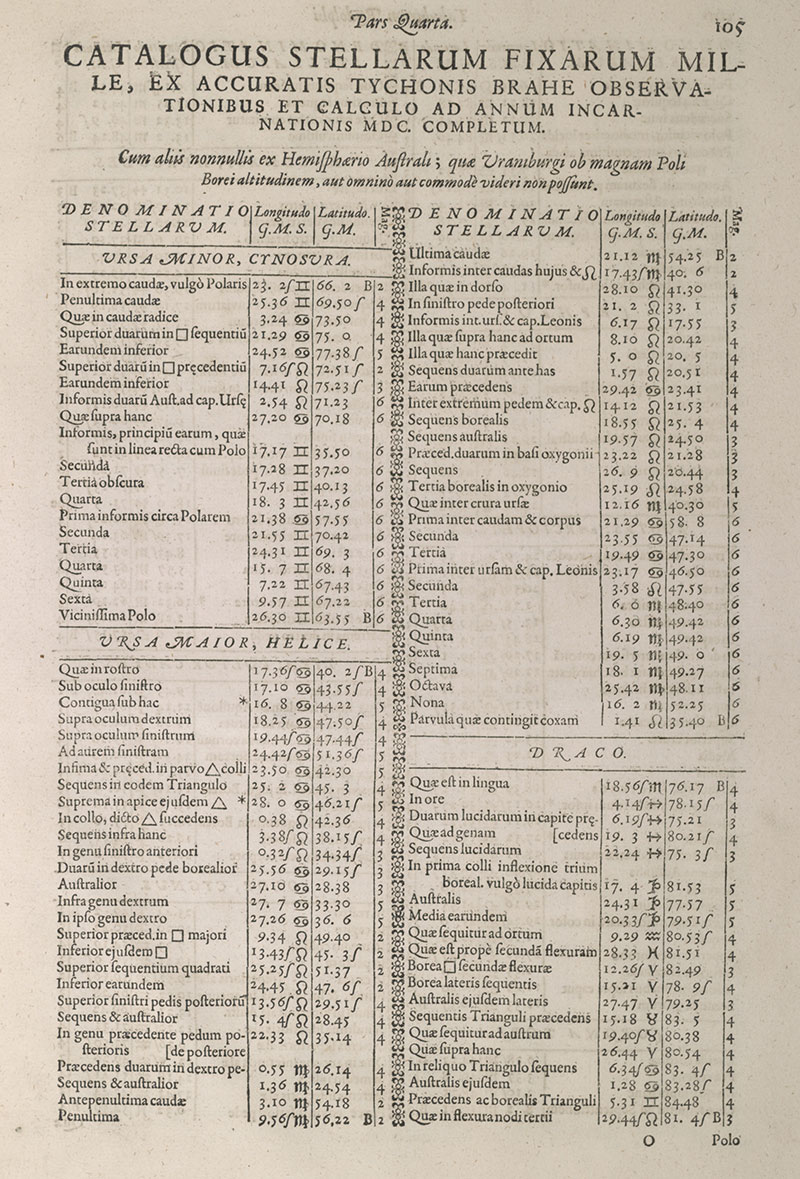
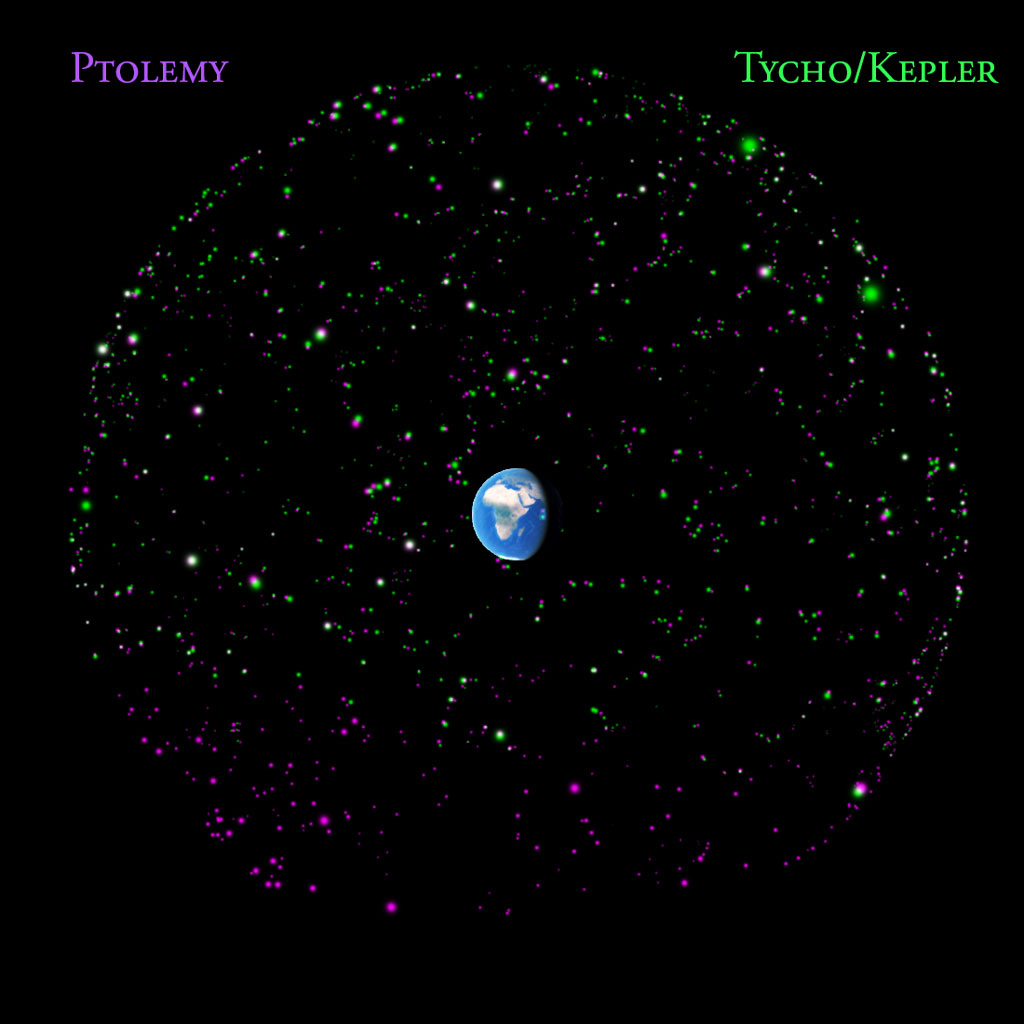
Using a similar method as above, with some minor modifications due to the way the data is structured, we can transform these manuscripts to a data format we can work with. Others have already done most of the heavy lifting, we just have to run some coordinate transforms and data format fixes. Here are the stars from the Almagest (in PURPLE) and the stars from Kepler’s Tables, based on Tycho’s measurements (in GREEN) shown on a sphere around the earth. Again, these astronomers didn’t have any reasonable means to assess the distance to these stars since telescopes were still a few years away, and their cosmologies didn’t require it either – all the stars were fixed in the crystalline celestial spheres.
And now, thanks to the powers of OpenGL we can see these catalogs from the vantage point of the earth, just as these ancient astronomers might have thousands of years ago. Here’s a quick animation showing the evolution of the data sets from the vantage point of the surface of the earth.
It’s easy to see the transition from the Modern Hipparcos Catalog to Ptolemy’s. His data had plenty of systematic and acute errors. And then, again from Ptolemy to Tycho, the deltas are obvious. However, during the fade from Tycho back to Hipparcos, it’s nearly impossible within the presented field of view to see the difference (for many stars). The errors and history of these data sets has been explored very thoroughly in the literature and make for great studies in the history of science and data. But, visualizing them in an immersive planetarium experience is about as close to time travel as we can get.
Stay tuned to our channels, since we’ll likely have some shows featuring this material when we return to in-person formats.
Cosmic Conversation
We had a great conversation with the Morrison Planetarium about these data sets. Check it out here:
Notes
- We used the word ‘made’ in reference to the measurements of the star positions. However, it is very likely that Ptolemy did not in fact make many of these measurements, but instead updated and transformed the existing catalog of the ancient Greek astronomer Hipparchus.
Further Reading and References:
Graßhoff: The History of Ptolemy’s Star Catalogue Gerd Graßhoff, Springer-Verlag New York, 1990
Peters: Ptolemy’s catalogue of stars: a revision of the Almagest Ptolemy, 2nd cent; Peters, Christian Heinrich Friedrich, 1813-1890; Knobel, E. B. (Edward Ball), b. 1841
Ptolemy/Toomer: Ptolemy’s Almagest, Springer New York, 1984
F. Verbunt and R. H. van Gent: Three editions of the star catalogue of Tycho Brahe A&A Volume 516, June-July 2010
F. Verbunt and R. H. van Gent: The star catalogues of Ptolemaios and Ulugh Beg A&A Volume 544, August 2012
Almagest Manuscript: Library of Congress, Almagestū Cl. Ptolemei, 1515
Kepler Manuscript: Library of Congress, Tabvlæ Rudolphinæ, 1627
The content is rendered using the open-source Astrovisualization framework OpenSpace which is a collaboration between Linköping University, the American Museum of Natural History, Goddard’s Community Coordinated Modeling Center, New York University, and the University of Utah.
About the author
Dr. Hedberg studied the ancient cosmologies of Ptolemy, Tycho, and Kepler as an undergrad at St. John’s College (Santa Fe) as part of the Program’s Mathematics tutorial, though the college didn’t have this beautiful tool when he attended there. Since then, his work in programming and science visualization sometimes takes delightful detours into the past:
I've always thought #Kepler's nested solid model would be fun to animate. Though not based on what we would now deem 'physics', he must have nonetheless been pretty excited when he figured out these ratios. I get excited just watching. #historyofastronomy pic.twitter.com/SOwPfWciTI
— James Hedberg (@jameshedberg) September 2, 2020